FSP-1 expression in cancer cells is relevant to long-term oncological outcomes in nonmetastatic colorectal cancer
Article information

Abstract
Purpose
Recent studies have revealed that the expression of cancer-associated fibroblast (CAF) activation biomarkers in cancer cells is associated with clinical outcomes in patients with certain types of malignant tumors. However, whether the expression of CAF activation biomarkers affects the prognosis of colorectal cancer (CRC) has not been fully elucidated. This study aimed to evaluate the association between the expression of CAF activation biomarkers in cancer cells with cancer invasion and long-term oncological outcomes in patients with CRC.
Methods
Cancer specimens obtained from 135 patients with stage I–III CRC were examined using immunohistochemical staining to evaluate the expression of fibroblast specific protein-1 (FSP-1), fibroblast activation protein α (FAPα), α-smooth muscle actin (α-SMA), and vimentin in cancer cells.
Results
FSP-1 expression in cancer cells was significantly associated with lymphatic invasion, perineural invasion, tumor (T) status, and lymph node (N) status. FAPα expression in cancer cells was significantly associated with lymphatic invasion. On univariate and multivariate analyses, FSP-1 and α-SMA expression in cancer cells were associated with a short 10-year overall survival (OS) and high 10-year systemic recurrence (SR), respectively. Tumor budding was associated with a short 10-year OS. However, FAPα and vimentin did not contribute to the prognosis in this study.
Conclusion
In this study, we found that FSP-1 expression in cancer cells was related to cancer invasion. Additionally, FSP-1 and α-SMA expression in cancer cells was associated with 10-year OS and SR, respectively. Therefore, these markers may be used as predictors of long-term oncological outcomes in patients with CRC.
INTRODUCTION
Colorectal cancer (CRC) is one of the most common gastrointestinal cancers worldwide. Although diagnostic methods and treatments for CRC have continuously improved, a significant proportion of the patients still progress to a metastatic stage with a poor prognosis [1]. Recently, many studies have revealed that epithelial-to-mesenchymal transition (EMT) is involved in cancer invasion and metastasis [2]. Additionally, EMT has been found to be associated with the expression of cancer-associated fibroblast (CAF) activation biomarkers, including fibroblast specific protein-1 (FSP-1; or S100A4), fibroblast activation protein α (FAPα), α-smooth muscle actin (α-SMA), and vimentin [3–5]. In particular, the expression of CAF activation biomarkers in the tumor microenvironment is related to the clinical outcomes of CRC patients [6].
FSP-1, also called S100A4, is a member of the S100 family of calcium binding proteins. FAPα is a type II integral membrane protein belonging to the family of plasma membrane-bound serine proteases. α-SMA expressing myofibroblasts are representative of activated CAFs and wound healing [6]. Vimentin is one of the most widely expressed and highly conserved proteins of the type III intermediate filament protein family [7].
Previous studies have reported that CAF activation biomarkers are also expressed in cancer cells [8–10]. Moreover, in ovarian cancer and intrahepatic cholangiocarcinoma patients, the expression patterns of CAF activation biomarkers in cancer cells correlated with overall survival (OS) [9,10]. These studies suggested the possibility that expression of CAF activation biomarker in cancer cells might be associated with EMT. However, in CRC, the correlation of the expression of CAF activation biomarkers in cancer cells with long-term oncological outcomes remains unclear.
Therefore, this study aimed to investigate the relationship between the expression of CAF activation biomarkers in cancer cells with cancer invasiveness and long-term oncological outcomes in patients with nonmetastatic CRC.
METHODS
Patients
CRC patients who underwent surgical resection between January 2010 and June 2014 at the Pusan National University Yangsan Hospital were screened for this study. Of the 200 patients with CRC, 65 were excluded due to the absence of staining data for FSP-1, FAPα, and α-SMA (n=49) or the presence of stage IV CRC (n=16). Thus, we finally analyzed 135 eligible patients with CRC. During a median follow-up of 122 months (range, 0–148.3 months), 36 of the 135 patients (26.7%) died. This study was conducted after obtaining the approval of the Institutional Review Board of the Pusan National University Yangsan Hospital (IRB No. 05–2016–097). Written informed consent was obtained from all the patients.
Clinicopathological characteristics and survival data were collected from the outpatient records and telephone visits. Clinical factors comprised age, sex, body mass index, serum carcinoembryonic antigen (CEA), colon obstruction, and cancer location. Pathological factors comprised tumor size, stage, and histological differentiation of cancer cells. Size of the formalin-fixed tumor was measured in two dimensions. TNM staging was performed according to the criteria of the 8th edition of the American Joint Committee on Cancer [11]. Tumor histological types and differentiation were categorized into well differentiated (G1), moderately differentiated (G2), and poorly differentiated (G3). This 3-tier system is based on a grading system described by the World Health Organization [12].
We analyzed the OS, disease-free survival (DFS), systemic recurrence (SR), and local recurrence (LR) of patients with CRC during a 10-year follow-up. All patients underwent postoperative surveillance using abdominal and thoracic computed tomography and serum CEA measurements every 6 months. Metastasis to other organs, such as the liver and lungs, and intra-abdominal disseminated metastasis were considered SR. Cancer recurrence at the site of the primary carcinoma was considered LR.
Molecular biomarkers
For immunohistochemistry (IHC) staining, paraffin tissues were cut into 4-μm thick sections and fixed with xylene and ethanol. For antigen retrieval, the slides were placed in a microwave oven for 10 minutes at 5-minute intervals in 10 mmol/L citrate buffer (pH 6.0) and cooled to room temperature for 1 hour, after which endogenous peroxidases were blocked with 3% H2O2. The cells were blocked with 1% bovine serum albumin (Thermo Fisher Scientific, Rockford, IL, USA) for 30 minutes.
The slides were incubated with primary antibodies for epidermal growth factor receptor (EGFR; mouse monoclonal antibody, clone: E30, M7239, DAKO, Glostrup, Denmark), CEA (mouse monoclonal antibody, clone: II-7, DAKO), p53 (mouse monoclonal antibody, clone: DO-7, NCL-L-p53-DO7, Novocastra, Newcastle upon Tyne, UK), FSP-1 (S100A4, Novus Biologicals, Centennial, CO, USA), FAPα (Novus Biologicals), α-SMA (DAKO), and vimentin (Ab92547, Abcam, Cambridge, UK) at 4°C for 24 hours. The slides were then washed and incubated with the appropriate secondary antibody for 1 hour. EGFR expression was considered positive when it was detected in >10% of the cancer cells. Cytoplasmic CEA accumulation was considered positive in cases in which >10% of the tumor cells showed cytoplasmic staining. Nuclear accumulation of p53 was considered positive when it was detected in >10% of the tumor cells. The same process was repeated for the CAFs in the invasive front.
IHC grades of FSP-1, FAPα, α-SMA, and vimentin in cancer cells and CAFs were measured using the intensity and percentage of staining as follows: grade 1, weak staining in <50% or moderate staining in <20% of stromal cells; grade 2, weak staining in ≥50%, moderate staining in 20%–49%, or strong staining in <20%; and grade 3, moderate staining in ≥50% or strong staining in ≥20%. IHC grades 1–2 were considered negative, and grade 3 was considered positive (Fig. 1) [13].
Immunohistochemical staining of fibroblast specific protein-1 (FSP-1), fibroblast activating protein α (FAPα), α-smooth muscle actin (α-SMA) in cancer cells (×20) and immunohistochemical staining grade system.
K-ras proto-oncogene (KRAS; exons 12 and 13) mutation, B-raf proto-oncogene (BRAF; exon v600E) mutation, and microsatellite instability (MSI) were detected using real-time reverse transcription quantitative polymerase chain reaction (RT-qPCR) with paraffin block tissue [14]. MSI-high was defined as instability in at least two of the five microsatellite loci, MSI-low as instability in only one locus, and microsatellite stability as instability in no locus.
Evaluation of cancer invasiveness
The T status, N status, lymphatic, venous, and perineural invasions, tumor budding, and tumor growth pattern (expanding or infiltrating type) were examined to evaluate the invasiveness of the cancer cells. Lymphatic invasion was identified by the presence of tumor cell clusters in the endothelial-lined space without a muscular coat. Venous invasion was defined as tumor cell cluster in spaces with a muscular coat. Perineural invasion was defined as the spread of cancer cells into the space surrounding the nerves. Tumor budding was defined as a single cell or cluster of fewer than five cells in the stroma around the tumor. Tumor budding was evaluated in 10 high-power fields (HPFs) at high magnification (×40) and stratified into grade 1 (0–4/10 HPF), grade 2 (5–9/10 HPF), grade 3 (10–19/10 HPF), and grade 4 (≥20/10 HPF). Grade 3–4 tumor budding (≥10/10 HPF) was considered positive [15]. Tumor growth patterns were classified into the expanding type, which grows by pushing the surrounding stroma, and the infiltrating type, which grows by penetrating the stroma. All pathological evaluations were performed by one pathologist (DHS) who had no prior knowledge of the clinicopathological data.
Statistics
Fisher exact test was used to evaluate the correlation between clinicopathological characteristics, including cancer invasiveness, and CAF activation biomarker expression in cancer cells. The Kaplan-Meier method and log-rank test were used to analyze OS, DFS, SR, and LR. For multivariate analysis, the Cox proportional hazards model was used with stepwise and backward selections. The covariance input criterion was <0.15. We also performed network analysis of the clinicopathological characteristics, cancer invasiveness factors, and CAF activation biomarker expression in cancer cells. Network analyses and heatmaps were performed based on robust Spearman correlation (rho) measures for all the collected parameters. Positive (rho <0.2) and negative (rho <−0.2) associations were represented by blue and red lines (edges), respectively. The R software (version 4.2.0, R Foundation for Statistical Computing, Vienna, Austria) was used for statistical analysis, and the significance level was two-tailed, with P<0.05.
RESULTS
FSP-1, FAPα, and α-SMA expression and correlation with clinicopathological characteristics
The correlations between the expression of CAF activation biomarkers in cancer cells and clinicopathological characteristics are shown in Table 1. Among the 135 patients with CRC, the expression rates of FSP-1, FAPα, α-SMA, and vimentin in cancer cells were 17.9% (24/134), 29.1% (32/110), 23.0% (31/135), and 0% (0/135), respectively. FSP-1 and α-SMA expressions in cancer cells were significantly associated with advanced stages (P=0.004 and P=0.027, respectively). However, FAPα expression in cancer cells was not significantly associated with any clinicopathological characteristic.
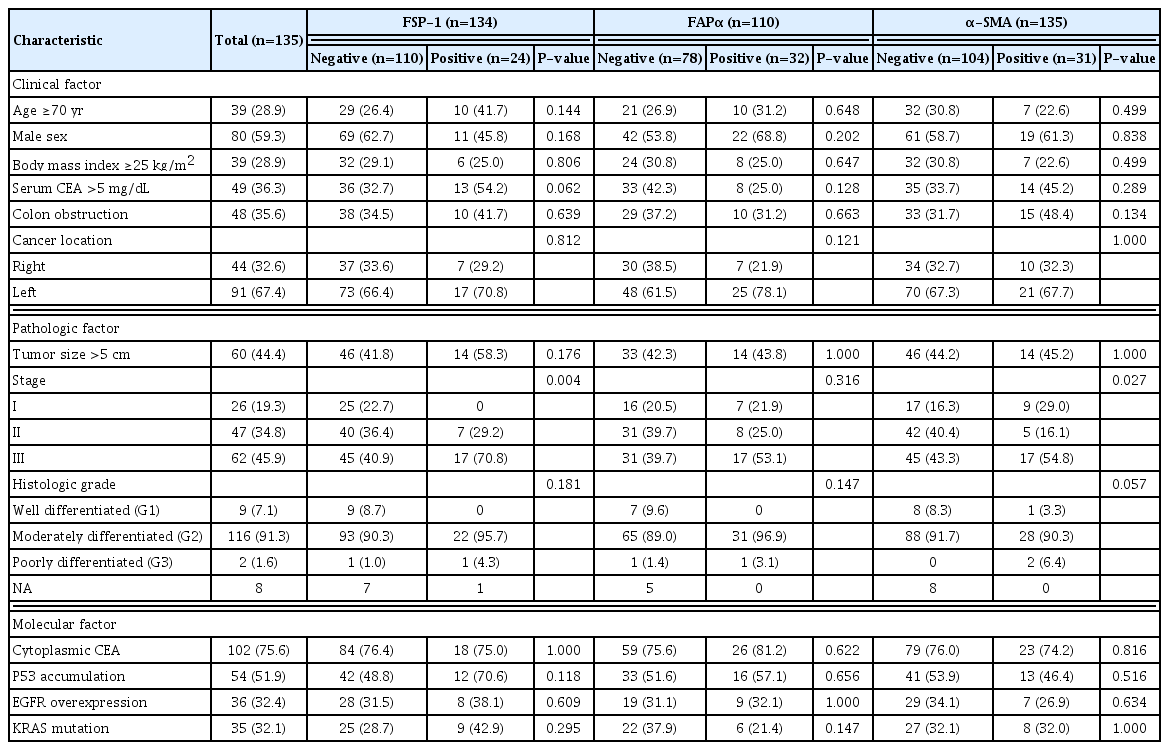
Correlation of clinicopathological characteristics with cancer-associated fibroblast activation biomarker expressions in cancer cells
FSP-1, FAPα, and α-SMA expression and correlation with cancer invasiveness
The correlations between the expression of CAF activation biomarkers in cancer cells and cancer invasiveness factors are shown in Table 2. FSP-1 expression in cancer cells was significantly associated with lymphatic invasion, perineural invasion, T status 3–4, and N status 1–2. FAPα expression in cancer cells was significantly associated with lymphatic invasion.

Correlation of cancer invasiveness with cancer-associated fibroblast activation biomarker expressions in cancer cells
Network analysis and heatmap
To visualize the correlation between CAF activation biomarker expression in cancer cells and cancer invasiveness factors, we performed a network analysis and created a heatmap (Fig. 2). In the network analysis using Spearman correlation coefficients, the critical nodes with more than five edges of significant correlation were FSP-1 expression in cancer cells, T status, lymphatic invasion, perineural invasion, and colon obstruction.
(A) Network analysis of Spearman’s coefficients of correlation. The red line represents significant correlation with a coefficient >0.2. The blue line represents reverse correlation with a coefficient <−0.2. (B) Heatmap of Spearman’s coefficients of correlation. CAF, cancer-associated fibroblast; FSP, fibroblast specific protein; FAP, fibroblast activating protein; SMA, smooth muscle actin; BMI, body mass index; CEA, carcinoembryonic antigen; EGFR, epidermal growth factor receptor; KRAS, K-ras proto-oncogene; BRAF, B-raf proto-oncogene; MSI, microsatellite instability.
In the heatmap generated using Spearman correlation coefficients, FSP-1 expression in cancer cells formed clusters that included T status 3–4, N status 1–2, lymphatic invasion, and perineural invasion. FAPα expression in cancer cells was associated with lymphatic invasion.
Univariate and multivariate analyses of OS, DFS, LR, and SR
In the univariate analyses using the log-rank test, FSP-1 expression in cancer cells, lymphatic invasion, tumor budding, old age, male sex, elevated serum CEA levels, and colon obstruction were found to be unfavorable prognostic factors for 10-year OS (Fig. 3). Lymphatic invasion, T status 3–4, old age, colon obstruction, and EGFR overexpression were unfavorable prognostic factors for 10-year DFS (Fig. 4).

Ten-year overall survival of patients with colorectal cancer. (A) Cancer cell fibroblast specific protein (FSP). (B) Cancer cell fibroblast activating protein (FAP). (C) Cancer cell smooth muscle actin (SMA). (D) Lymphatic invasion. (E) Tumor budding. (F) Age. (G) Sex. (H) Serum carcinoembryonic antigen (CEA). (I) Obstruction.
Ten-year disease-free survival of patients with colorectal cancer. (A) Cancer cell fibroblast specific protein (FSP). (B) Cancer cell fibroblast activating protein (FAP). (C) Cancer cell smooth muscle actin (SMA). (D) Lymphatic invasion. (E) T status. (F) Age. (G) Obstruction. (H) Epidermal growth factor receptor (EGFR).
α-SMA expression in cancer cells, T status 3–4, N status 1–2, lymphatic invasion, high stage, old age, male sex, and EGFR overexpression were found to be unfavorable prognostic factors for 10-year SR (Fig. 5). FAPα expression in CAFs, elevated serum CEA levels, and colon obstruction were unfavorable prognostic factors for 10-year LR (Fig. 6).
Ten-year systemic recurrence of patients with colorectal cancers. (A) Cancer cell fibroblast specific protein (FSP). (B) Cancer cell fibroblast activating protein (FAP). (C) Cancer cell smooth muscle actin (SMA). (D) Lymphatic invasion. (E) T status. (F) N status. (G) Stage. (H) Age. (I) Sex. (J) Epidermal growth factor receptor (EGFR).
Ten-year local recurrence of patients with colorectal cancer. (A) Cancer cell fibroblast specific protein (FSP). (B) Cancer cell fibroblast activating protein (FAP). (C) Cancer cell smooth muscle actin (SMA). (D) Cancer-associated fibroblast (CAF) fibroblast activating protein (FAP). (E) Serum carcinoembryonic antigen (CEA). (F) Obstruction.
Multivariate analysis using the Cox proportional hazards model showed that FSP-1 expression in cancer cells, tumor budding, old age, male sex, and colon obstruction were independently associated with the 10-year OS. T status 3–4, lymphatic invasion, old age, male sex, and EGFR overexpression were independently associated with the 10-year DFS (Table 3).
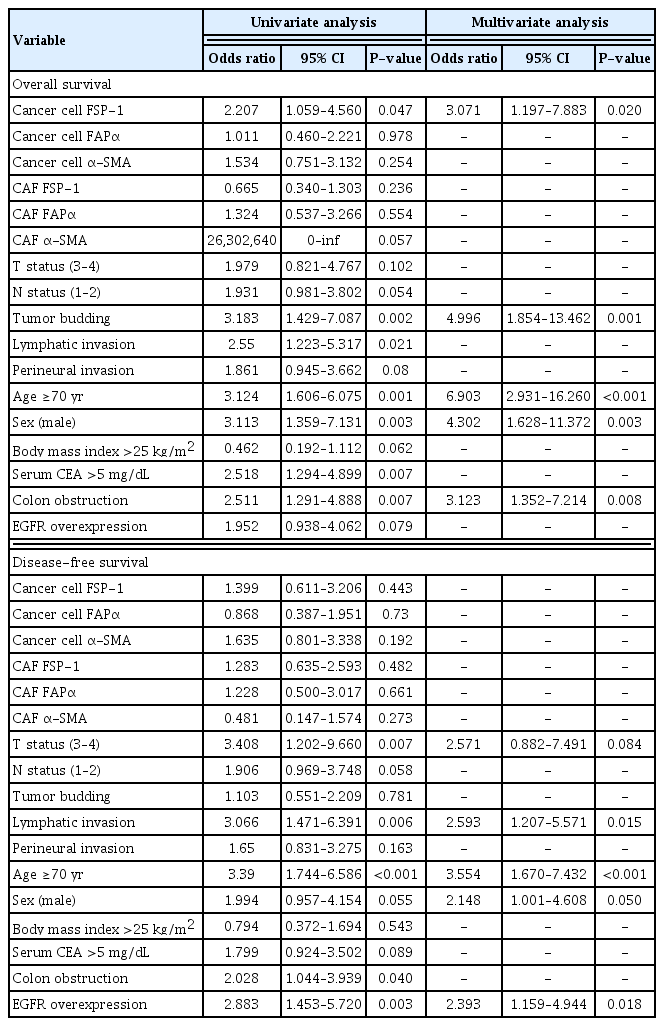
Univariate and multivariate analyses of 10-year overall survival and 10-year disease-free survival for patients with colorectal cancer (n=135)
α-SMA expression in cancer cells, T status 3–4, lymphatic invasion, old age, male sex, and EGFR overexpression were independently associated with the 10-year SR. FAPα and FSP-1 expression in CAFs and elevated serum CEA levels were independently associated with the 10-year LR (Table 4).
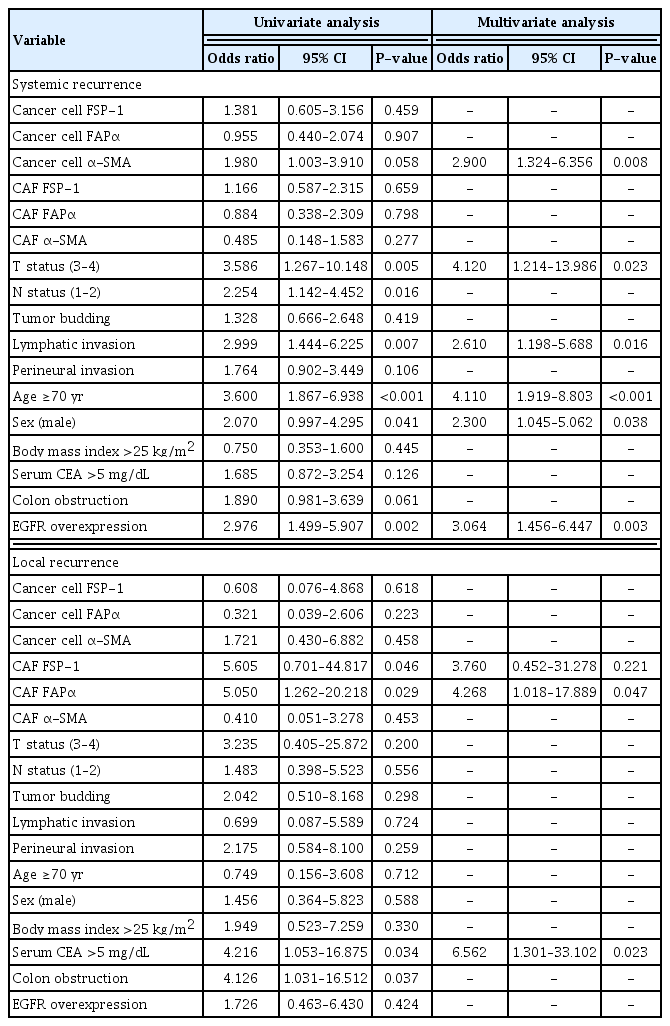
Univariate and multivariate analyses of 10-year systemic recurrence and 10-year local recurrence
DISCUSSION
Previous studies have revealed that the expression of CAF activation biomarkers in the stroma is involved in cancer progression [8,16–18]. However, whether CAF activation biomarker expression in cancer cells is related to cancer progression has not been fully elucidated. Therefore, we evaluated the association between the expression of CAF activation biomarkers in cancer cells with cancer invasiveness and long-term oncological outcomes in patients with CRC.
We found that the expression of CAF activation biomarkers in cancer cells correlated with cancer invasiveness. Additionally, survival analysis showed that the expression of CAF activation biomarkers in cancer cells, especially FSP-1 and α-SMA, was associated with long-term oncological outcomes.
FSP-1 expression in cancer cells significantly correlated with cancer invasiveness factors including lymphatic invasion, perineural invasion, T status, and N status. These findings are consistent with the results of previous studies showing that FSP-1 expression in cancer cells is associated with cancer invasion [19]. In addition, previous studies have shown that FSP-1 expression in cancer cells is involved not only in cancer invasion, but also in EMT. Since FSP-1 is a biomarker of mesenchymal properties, it is also used as an EMT marker in cancer cells of epithelial origin. Additionally, FSP-1 has been shown to be involved in cancer invasion by increasing cell motility and angiogenesis [20,21]. Therefore, it can be presumed that FSP-1 expression in cancer cells is involved in cancer invasion through EMT.
Regarding OS, FSP-1 expression in cancer cells and tumor budding were found to be statistically significant in both univariate and multivariate analyses. Interestingly, patients expressing FSP-1 showed a low DFS of up to 2 years and a high SR of up to 2 years, which was statistically significant in the univariate analysis. Therefore, FSP-1 expression may be a factor indicating early recurrence of CRC within 2 years. These results are supported by previous studies suggesting that FSP-1 expression is associated with an unfavorable prognosis and recurrence in colorectal, breast, and lung cancers [18,21,22].
However, several studies have found that the correlation between FSP-1 expression in cancer cells and OS was statistically significant in the univariate analysis but not in the multivariate analysis in patients with CRC [18,23]. We speculated that this discrepancy was due to differences in the patient groups. The patient group in other studies mostly consisted of patients with advanced and metastatic cancer, whereas our patient group consisted of patients with nonmetastatic cancer including early-stage patients. Therefore, these results suggest that FSP-1 expression in cancer cells may be used as an unfavorable prognostic marker for OS in nonmetastatic CRC.
On the other hand, α-SMA expression in cancer cells and T status were significantly related to SR. Previous studies have shown that cancer cells undergoing EMT can express α-SMA, a mesenchymal protein, while acquiring mesenchymal characteristics. In addition, it was found that cells with mesenchymal characteristics can be involved in invasion and metastasis through processes such as intravasation, extravasation, and micrometastasis [20]. Therefore, the results of our study suggest that α-SMA expression may be involved in cancer invasion and metastasis via EMT.
In recent years, as it has been found that EMT affects cancer progression, many studies on EMT have been conducted. Several studies have reported that the loss of E-cadherin or expression of transcription factors, including Twist1/2, SNAIL, and SLUG, and dysregulation of microRNA (miRNA) are characteristic of EMT [24,25].
Although the presence of EMT can be accurately confirmed through RNA analysis, including western blotting and RT-qPCR, those methods are more expansive than IHC staining. Therefore, if the presence of EMT can be confirmed by IHC staining using molecular biomarkers commonly used in clinical practice like FSP-1 and α-SMA, it is expected that there will be clinical advantages in confirming EMT and predicting the prognosis at a lower cost compared to RT-qPCR.
Surprisingly, contrary to our hypothesis that vimentin expression that indicates mesenchymal properties, would be observed in cancer cells undergoing EMT, none of the cancer cells in our study showed vimentin expression.
Considering that most of the patients in our study had moderately differentiated cancer among nonmetastatic cancer patients, these results can partially be explained by previous study showing that vimentin is mainly expressed and related to unfavorable prognosis in poorly differentiated cancer in advanced stage [26]. Another previous meta-analysis study that covers all stages of CRC showed that vimentin is mainly expressed in N status 1–2 [27]. In our study, while there was no vimentin expression by anyone, proportion of N stage 1–2 was 45.9%, which is different from the meta-analysis study result. In our study, vimentin strongly stained stromal cells but not cancer cells. This may be due to differences in IHC methods, such as using a slightly different antibody for each laboratory.
Therefore, based on the results of our study alone, there is insufficient evidence to suggest that vimentin expression is not observed in nonmetastatic cancer, including early cancer, and is not related to EMT and prognosis. Further research is warranted to determine whether vimentin expression is observed in the nonmetastatic patient group, whose histological grade is different from ours, and how it is related to EMT and prognosis.
Additionally, as several studies have shown in early-stage cancer, loss of E-cadherin, transcription factor expression, and dysregulation of miRNA can be better indicators of EMT and are more relevant to prognosis [7,20,28]. Therefore, further studies on the relationship between vimentin expression, EMT indicators, and prognosis are needed in patients with nonmetastatic cancer.
This study had some limitations. First, the patient group and clinical data were collected from a single institution, and the total number of patients (n=135) was small. Therefore, a large-scale multicenter study involving more patients will be needed to search and validate for noble molecular markers predicting the aggressiveness of cancer cells. These molecular markers will be an important basis for precision medicine that predicts the possibility of metastasis after surgery and applies adjuvant chemotherapy as the patient-tailored medicine. Second, the CAF activation biomarkers used in this study are only a small fraction of the numerous biomarkers expressed in CAF, and the use of other markers such as tenascin-C, desmin, podoplanin, and PDGFR-α/β [3] may yield different results. In addition, considering that there are several CAF subtypes and that each CAF activation biomarker can be expressed in any subtype, the expression of these biomarkers in cancer cells can also occur through various mechanisms. Therefore, additional studies are required to elucidate these molecular pathways. Third, in the process of statistical analysis, we classified variables like biomarker expression grade and invasion parameters into two categories, and various cutoff values were used. Thus, the result may be different if the cutoff value changes, and the change of the number of patients in a specific group during categorization may cause distortion. For example, when the cutoff for FAPα positivity was set to grade II or higher, the 40.9% belonged to the FAPα-positive group, but when the cutoff for FAPα positivity was set to grade III, approximately 30% were in the FAPα-positive group. To avoid distortion of statistical results due to changes in the cutoff value, the cutoff value may be determined using the receiver operating characteristic curve. Fourth, this study simply revealed a correlation between CAF activation biomarker expression in cancer cells with cancer invasiveness and long-term oncological outcomes. Therefore, this study could not prove that FSP-1 and α-SMA expression in cancer cells was involved in cancer progression through EMT. Further studies on the relationship between FSP-1 and α-SMA knock out cancer cells and EMT are needed to determine the exact molecular pathway involved in EMT induced by the expression of these biomarkers in cancer cells.
In conclusion, FSP-1 expression in cancer cells significantly correlated with cancer invasiveness factors, including lymphatic invasion, perineural invasion, T status, and N status. In addition, FSP-1 and α-SMA expression was associated with OS and SR, respectively. These results suggest that FSP-1 and α-SMA expression in cancer cells can be used as a prognostic factor.
Notes
No potential conflict of interest relevant to this article was reported.
FUNDING
None.