성향점수매칭 분석법을 이용한 복강경 유도하 저위전방절제술과 로봇 유도하 저위전방절제술 후 통증의 비교
The effect of laparoscopic versus robotic low anterior resection of rectum on postoperative pain: A propensity score matching analysis
Article information
Trans Abstract
Purpose
The aim of this study was to compare postoperative outcomes regarding pain and pain management in patients who underwent robot-assisted low anterior resection (RA-LAR) with laparoscopy-assisted low anterior resection (LA-LAR).
Methods
Medical records of adult patients who underwent LA-LAR (group L) or RA-LAR (group R) using robotic system (da Vinci Surgical System, Intuitive Surgical Inc., Sunnyvale, CA, USA) were collected prospectively at Chung-Ang University Hospital between January 1, 2010 and December 31, 2015. Patients were matched at a 1 to 1 ratio from Group L and R using propensity score-matching method. Intravenous patient-controlled analgesia (IV-PCA) was applied to the patients postoperatively, and the severity of postoperative pain visual analogue scale (VAS) and nausea as the numerical rating scale (NRS) was evaluated. The incidence of vomiting, dizziness, headache, and PCA clamping was also recorded. Additional fentanyl was administered as a rescue analgesic if the VAS score was over 3, and until VAS was less than 3.
Results
In the overall series, there was no significant difference between group L and group R regarding pain VAS, nausea NRS, number of vomiting episodes at day 0 and day 1. However, after propensity score analysis, pain VAS and the use of rescue analgesic at day 0 was lower in group L compared to group R (P=0.038, P=0.040).
Conclusion
In regards to postoperative pain, RA-LAR did not show clear benefit over LA-LAR.
INTRODUCTION
For the past few decades, improvement of oncologic outcome was the main concern in the treatment of rectal cancer, and the optimization of surgical procedure with the introduction of total mesorectal excision (TME) was a main innovation together with multimodal preoperative chemoradiation therapy for locally advanced stage disease [1–3]. The outcome of surgery for rectal cancer has improved substantially during the past two decades due to TME, which involves complete removal of the mesorectum with preservation of the pelvic autonomic nerves. Local recurrence rate of rectal cancer has fallen sharply because radially spread cancer cells in the mesorectum are removed by complete resection of this tissue [4–6].
In addition, there is the continued drive towards improving quality of life, and minimally invasive surgery (MIS) is slowly taking over as the preferred operative approach for colorectal diseases [7]. The use of minimally invasive techniques in colorectal surgery is generally regarded as a safe and feasible modality with a shorter postoperative recovery time [8–10]. Robot-assisted low anterior resection (RA-LAR) has become the new technological trend in surgery. The procedure has been suggested to have potential for advanced stereoscopic vision, lack of tremor, the ability to rotate and articulate the instruments, and complexity of procedures performed from wristed instruments [11,12].
There have been enormous amounts of studies that compared main outcome measures, which were hospital length of stay (LOS), operative time, complications, and costs between robot-assisted surgery and laparoscopic surgery. Analgesia has been one of the main strategies of an affected morbidity and duration of hospital stay, and postoperative pain relief is closely related to acceleration in recovery [13,14]. There are various studies that have compared open surgery with MIS; however, there are a minimal number of articles that compared MIS modalities. In this sense, the aim of this study was to compare postoperative outcomes regarding pain and pain management in patients who underwent RA-LAR with laparoscopy-assisted low anterior resection (LA-LAR).
METHODS
Study design
We reviewed medical records of adult patients who underwent LA-LAR or RA-LAR using a robotic system (da Vinci Surgical System, Intuitive Surgical Inc., Sunnyvale, CA, USA) at Chung-Ang University Hospital between January 1, 2010 and December 31, 2015 from a prospectively collected database. In this database, all patients used intravenous patient-controlled analgesia device (PCA) for postoperative pain control. Patient's information was correctly anonymized and identified prior to analysis. The need for informed consent was waived for this study. We classified the patients into two groups, group L (underwent LA-LAR) and group R (underwent RA-LAR).
This manuscript was prepared according to the Strengthening the Reporting of Observational Studies in Epidemiology checklist [15].
The flow of postoperative pain management
In our institution, the identical standardized flow for pain management following LA-LAR or RA-LAR is applied to patients who want pain control through the PCA device.
During the preoperative visit, patients were given instructions for use of the 10-Visual analogue scale (VAS; 0, no pain; 10, worst pain imaginable) and PCA. Specifically, patients were instructed to push the button of the PCA device, which delivered a bolus of analgesic, when they wanted more analgesic to be administered.
IV PCA protocol of LA-LAR or RA-LAR in our hospital was a 100 mL-mixture of 20 µg/kg of fentanyl, 180 mg of ketorolac (or 120 mg of nefopam), and 0.3 mg of ramosetron (or 0.25 mg of palonosetron) with a normal saline solution, with a release rate of 1 mL/hr, a bolus 1 mL, and a lockout interval of 15 minutes.
Postoperatively, a nurse dedicated to the management of patients with IV-PCA, evaluated the severity of postoperative pain VAS and nausea using a numerical rating scale (NRS; 0, none; 1, mild; 2, moderate; 3, severe; 4, worst nausea imaginable) immediately after surgery. She also recorded the incidence of vomiting, dizziness, headache, and PCA clamping. If VAS score was over 3, an additional 50 μg of fentanyl as rescue analgesic was administered until VAS was less than 3.
Data collection
Using the data recorded by a nurse dedicated to the management of patients with IV-PCA, we noted demographic and perioperative factors that were related to postoperative pain. The nurse only undertook tasks related to IV-PCA, and she did rounds at least once a day to investigate issues related to IV-PCA, including pain and postoperative nausea and vomiting (PONV). Demographic data were noted including patient age, gender, height, weight, and operation time. Perioperative variables known as possibly related factors of postoperative pain were also identified: the use of preintubation opioid; the use of inhalation anesthetic (desflurane or sevoflurane) and nitrous oxide; the use of nefopam or ketorolac.
Postoperative variables were collected: pain VAS score; nausea NRS score; the incidence of rescue analgesics and antiemetics; the number of vomiting; the incidence of dizziness, headache, and PCA clamping.
Statistical analysis
We matched patients at a 1 to 1 ratio from Group L and R using a propensity score-matching method. Because this was a retrospective cohort study, not a randomized clinical trial, potential confounding factors were caused by biased covariates and non-randomization; thus, comparability between group L and R was problematic. For this reason, we conducted propensity score matching—to decrease the potential confounding. We calculated the propensity score using logistic regression analysis; the following covariates were used: age, gender, height, weight, type of anaesthetic agents used (desflurane, or sevoflurane), use of N2O or remifentanil, use of anticholinergics (glycopyrrolate) as premedication, use of nefopam, ketorolac in IV-PCA, dosage of fentanyl in IV-PCA and operation duration.
After the propensity scores were calculated, we used propensity score similarities to select the nearest-available match between the groups; the caliper radius was set at 0.001. To evaluate the balance between the matched groups, we tested the standardized difference for each of the covariates mentioned above. Specifically, the standardized difference is the difference in means between the groups—in units of standard deviation. Comparability between the groups is usually considered to be good when the standardized difference is less than 30% [16].
For continuous variables, the data distribution was first evaluated for normality using the Shapiro-Wilk test. Normally distributed data were compared using parametric methods and non-normally distributed data were analyzed using non-parametric methods. Continuous variables were analyzed using Student's t-test or Mann-Whitney U test before propensity score matching, and paired t-test or Wilcoxon signed rank test after propensity score matching.
Descriptive variables were analyzed using χ2 analyses or Fisher's exact tests before propensity score matching, and McNemar test after propensity score matching. The P<0.05 was considered statistically significant. All statistical analyses were performed using SPSS for Windows ver. 23 (IBM Corp, Armonk, NY, USA).
RESULTS
The basic demographic and clinical characteristics of the patient population are detailed in Table 1. A total of 90 patients were included in this study, with 70 in group L and 20 in group R.
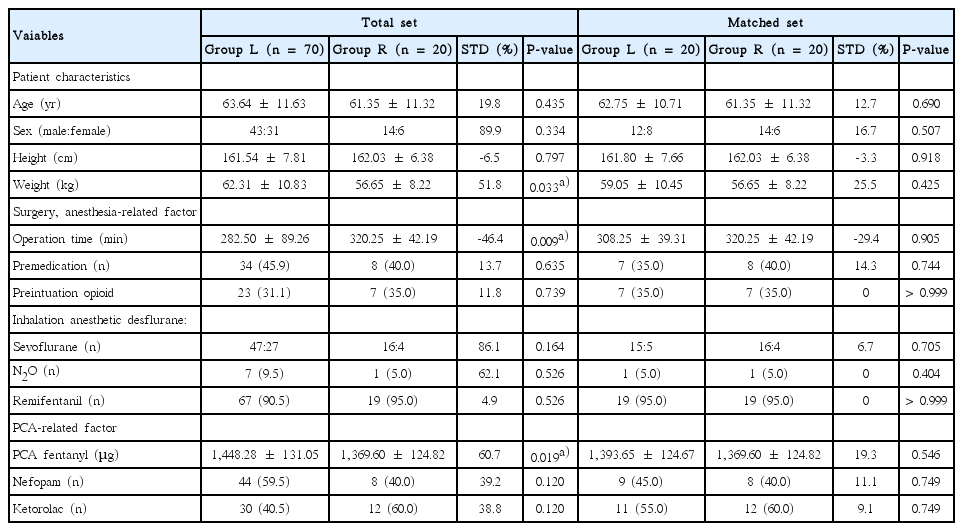
Patient characteristics in total and matched cohorts
Group L vs. Group R in the overall series
Of the 13 individual and composite predictors for confounding variables, 8 had poor standardized difference scores prior to propensity score matching. Compared with group L, subjects in group R had lower weight (62.31±10.83 vs. 56.65±8.22, P=0.033), experienced longer duration of OP time (282.50±89.26 vs. 320.25± 42.19, P=0.009), received lower dose of fentanyl (1,448.28± 1,31.05 vs. 1369.60±124.82, P=0.019) (Table 1).
There were no significant differences between group L and group R with respect to pain VAS, nausea NRS, and number of vomiting episodes at day 0 and day 1 (Table 2).

Perioperative variables before matching
Group L vs. Group R according to propensity score analysis
After propensity score analysis, there remained 20 patients in each group. All 13 confounding variables had acceptable standardized difference scores (i.e., <30%), indicating that the matching procedure was efficient in creating balance between the two groups. After adjusting propensity score analysis, pain VAS at day 0 showed lower in group L compared to group R (3.30±1.17 vs. 4.25±1.59; P=0.038). Also, use of rescue analgesic at day 0 showed significantly lower in group L compared to group R (0.75±0.64 vs. 1.35 ±0.93, P=0.040). However, no significant difference was observed in pain VAS and rescue analgesic at day 1, nausea NRS, rescue antiemetics, number of vomiting episodes at day 0 and day 1, dizziness, headache and clamping of PCA between group L and group R (Table 3).

Perioperative variables after matching
DISCUSSION
In this study, postoperative pain was compared by means of PCA and VAS score between the two groups of patients who underwent RA-LAR and LA-LAR, using propensity score matching method. As a result, RA-LAR had no clear benefit over LA-LAR with respect to the postoperative pain.
In the overall series, there were no significant differences between group L and group R with respect to pain VAS, nausea NRS, or number of vomiting episodes at day 0 and day 1. But, after propensity score analysis, pain VAS and use of rescue analgesic at day 0 was lower in group L compared to group R (P=0.038, P=0.040). This finding was at least partly explained by the longer duration of operative time in group R than group L as Table 2 shows (282.50± 89.26 vs. 320.25±42.19, P=0.009). However, this tendency disappeared at day 1, and overall pain did not show significant difference.
In articles that compared laparoscopic surgery and open surgery, there are obvious advantages of laparoscopic surgery over conventional open techniques which are less pain and faster return to normal functional status [9,17]. This difference might have resulted from the difference in the length of incision. Recently, Park et al. [18] presented the results of the first randomized clinical trial of robot-assisted colectomy versus laparoscopy-assisted colectomy for right-sided colonic cancer. In their study, the VAS pain score did not differ signifcantly between groups at 24, 72, and 120 hours after surgery. The only difference between the two groups was longer operative time and higher hospital costs for robotic surgery compared with laparoscopic surgery. Likewise, in our series, there was no significant difference in pain between group R and group L. Objective postoperative pain largely determined by the length of the incision, and similar length of the incision between the two groups seems to make no difference of the result in this study [9,17].
There were many articles that compared robot-assisted surgery and laparoscopic surgery [19,20]. However, there were only few that studied clinical pain of the patients, with the comparison between the variable of the two groups using categories to measure pain. In the study of Park et al., mentioned earlier, patients only used a subjective VAS at 24, 72, and 120 hours after surgery to express pain intensity. However, our study added the use of rescue analgesic along with VAS. Moreover, postoperative pain at the day of operation was checked to compare the change in pain, which is the strength of this study.
There are several limitations to consider in our study. The first limitation of this study is the small size of the study group. Second, as a retrospective nonrandomized study, our study cannot eliminate potential selection bias. Third, the present study is a single-center study. There is a need for research using multi-institutional data. Fourth, as the average period of PCA use was about 2 days, measurement of VAS score was limited to only postoperative day one. The short period of pain data would have limitations representing entire postoperative pain and recovery. Additional methods of collecting long periods of pain data should be discussed in further studies. Lastly, VAS, which was used as the index to measure pain of the patients, is subjective data, and is not an objective indicator.
When comparing postoperative pain between RA-LAR and LA-LAR, no difference was found. Compared in the aspect of postoperative pain, RA-LAR is not a superior surgical technique over LA-LAR.
CONFLICT OF INTEREST
No potential conflict of interest relevant to this article was reported.