프로테오믹 기법을 이용한 위암 바이오마커 연구
Gastric biomarker study using proteomic method
Article information
Trans Abstract
Biomarker is defined as biological variables that correlate with biologic outcome. This review will discuss investigations into gastric cancer (GC) biomarkers by proteomic analysis. Proteomic analysis consists of 3 steps. The first step is the digestion and separation process using 2-dimensional electrophoresis gel or liquid chromatography. The second step is mass analysis using mass spectrometry. The third step is protein identification using databases. Clinical validation of proteins identified can help estimate expressions of cancer tissue and cancer cell line using Western blot and immunohistochemistry. Researchers can validate the association between protein expression and clinical data (tumor stage, cell type, survival, and recurrence), which helps identify the possibility of biomarkers for GC. After clinical validation, the next step is functional analysis in vitro and in vivo. This step is commonly performed by knock-in and knock-out studies on the proliferation, migration, and invasion using the cancer cell line. Animal studies also provide indirect evidence for the role of the proteins in tumor growth and metastasis in vivo. In conclusion, the proteomic analysis is one of the useful methods for detecting biomarkers for GC. Multidisciplinary approaches to protein, DNA, RNA, and epigenetics are crucial to the investigation for molecular biomarkers for GC.
서 론
위암은 점차 감소하고 있지만, 2013년 암 등록통계에 의하면 전체 암 발생 중 갑상선 암에 이어 10만 명당 59.7명으로 2번째로 많이 발생하는 암이다. 남성에서는 10만 명당 80.2명으로 발생률 1위, 여성에서는 39.2명으로 4위이다[1,2]. 세계적으로도 전체 암 사망률 중 2위로 보고되고 있다. 우리 나라의 경우 국가 암등록 통계에 의하면 위암의 전체 생존율은 1993–1995년 43%에서 2001–2005년 58.4%를 거쳐 2009–2013년에는 73.1%로 약 10년만에 약 두 배 가량 상승하였다. 이러한 생존율의 향상은 수술 및 항암치료 등 치료기술의 발달 뿐 아니라, 전국민 암 검진으로 인한 조기 위암의 증가로 인한 것으로 분석되고 있다. Stage I의 빈도는 1995년 38%, 2004년 56.7%, 2011년도 66.7%로 크게 증가되었다[3].
조기 위암이 많아지고, 국민들의 조기 검진에 대한 관심이 높아지면서 각종 암종에서 바이오 마커에 대한 관심이 높다. 바이오 마커란 생물학적 결과와 관련된 생물학적 측정 가능한 변수(variable)라고 정의되고 있다[4]. 이러한 변수로는 분자생물학적인 변수 이외에도 tumor, node, metastasis (TNM) stage나 수술적 소견인 잔암(residual tumor)이 있는지 등도 중요한 예후를 측정할 수 있는 바이오 마커라고 할 수 있겠다. DNA, RNA가 유전자, 전사체(genome, transcriptome)로 불리고 이를 연구하는 학문을 유전체, 전사체학(Geomomics, transcriptomics)이라고 부르는 것과 같이 Wilkins 등[5]이 단백질을 단백질체(proteome), 이를 연구하는 학문을 단백질체학(proteomics)이라고 부름으로써 명명되었다. 본 종설에서는 위암에서 단백체학을 가지고 시행하는 분자 바이오 마커(molecular biomarker) 연구에 대하여 알아보기로 하겠다.
본 론
DNA에서 RNA가 복제되고, RNA에서 단백질이 전사되는 과정에서 서로 다른 정보를 가지게 된다. 전사체와 단백질체 간의 차이가 나는 이유는 mRNA의 안정성과 전사 후 번역의 효율 등이 단백질의 발현에 영향을 주기 때문이다. 따라서, RNA발현이 높다고 반드시 그 단백질의 발현이 높고 볼 수 없다. 단백체학으로 실제 발현된 단백질을 조사하게 되면 어떤 유전자가 실제 발현되었는지 알 수 있으므로, 매우 매력적이다. 단백체학은 크게 단백질의 분리에 필요한 이차원 전기영동(2 dimensional electrophoresis gel) 또는 액체 크로마토그래피(liquid chromatography), 단백질의 확인 동정에 필요한 질량분석법, 단백질의 상호작용을 이해하기 위한 효모 이중 하이브리드계(yeast two–hybrid system), 단백질의 구조 이해에 필요한 구조 유전체학, 단백질 자체의 구조를 연구하는 구조 프로테오믹스로 나눌 수 있다[6].
본 종설에서는 실제 임상연구자들이 많이 접하게 되는 단백질의 분리와 확인 과정(proteomic analysis)과 이를 암조직과 암세포주에서 면역화학염색을 통하여 임상적으로 확인하는 과정(clinical validation), 확인된 단백질의 기능을 세포주와 동물실험을 통해 확인하는 과정(functional analysis) 및 위암에서 프로테오믹스의 최신 동향에 대하여 알아보겠다(Fig. 1).
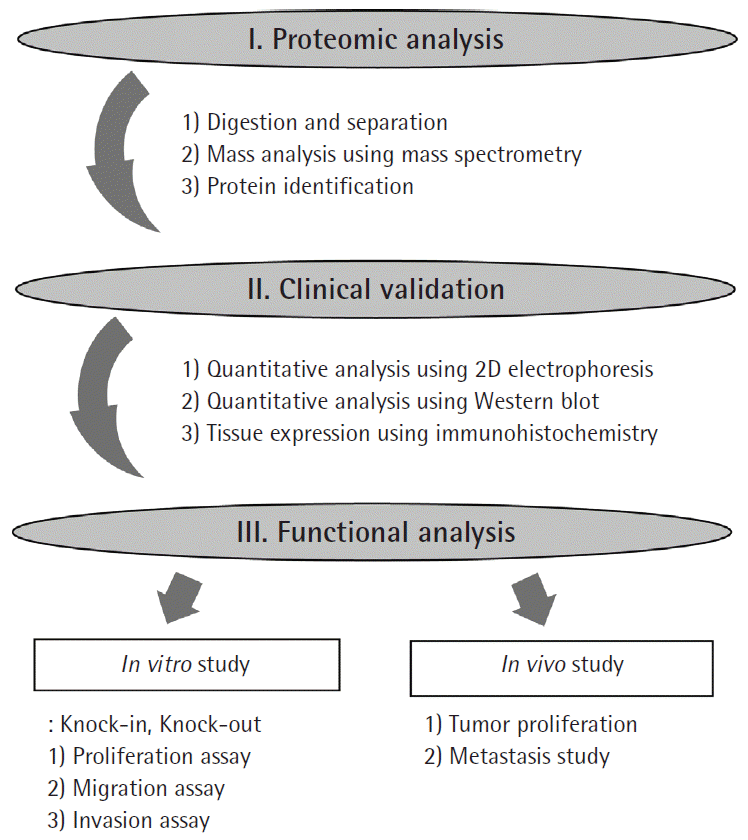
Flow chart of general proteomic study.
Proteomics analysis has 3 steps
Digestion and separation step
이차원 전기 영동(2 dimensional electrophoresis)에서 혈액, 세포주 샘플의 경우 분쇄과정이 불필요하나, frozen tissue의 경우 homogenizer로 먼저 물리적으로 조직 분쇄한다. 분쇄된 조직은 protease inhibitor가 포함된 용매에 녹인 후 pH gradient strips을 이용하여 1차원 전기영동을 시행하여 pH에 따라 좌우로 먼저 분리한 다음(isoelectric focusing), sodium dodecyl sulfate polyacrylamide slap gel (2D SDS gel)을 이용하여 분자량(molecular weight)에 따라 위아래로 전기영동으로 분리하여 이차원 전기영동을 완성한다[5,7]. 이렇게 분리된 단백질은 각각을 분리 채취하여, 이온화하여 질량분석기를 통해 각각이 어떤 단백질인지 확인하는 단백질 분석(identification)과정으로 넘어간다. 초기의 단순 이차원 전기영동에서 발전된 형태인 차별화 젤 전기영동(differential gel electrophoresis, DIGE)도 시행되고 있다. 이는 세 가지 조직을 서로 다른 형광염료(Cy5, Cy3, Cy2)로 염색 후 같은 젤에 올려 분석함으로써 세 조직에서의 단백질 발현율을 보다 정확하게 비교할 수 있겠다[8]. 이러한 이차원 전기영동을 기반으로 한 프로테오믹스 방법은 비교적 간단하면서 저렴한 비용으로 시행할 수 있다. 하지만, 노동 집약적이며 시간이 많이 소요되며 자동화가 어렵다. 또한 강산, 강염기를 가진 단백질과 수용성 단백질이 아닌 단백질의 경우 분석이 어렵다. 이런 여러 문제를 극복하기 위해 나온 기술이 액체 크로마토그래피 기술과 함께 질량분석이 결합된 방식이다(liquid chromatography/mass spectrometry, LC/MS). 액체 크로마토그래피에서 혼합물을 분리하고, 분리된 개개의 분석물은 이온화 장치에서 이온으로 만든 후 질량분석기로 분석을 하게 된다. LC/MS기술은 이차원 전기영동에 비해 비교적 실험시간이 짧고 자동화가 가능하여 크게 각광을 받고 있다(Fig. 2) [9]. 다중 단백질 동정기술(multi-dimensional protein identification technique, MudPIT)은 최근 개발된 2D LC분리 기술로 양이온 교환 column과 역상 column이 포함되어 있으며 향상된 컴퓨팅 기술로 전체 단백질 발현을 분석한다.

Flow chart of general proteomic analysis.
Mass analysis step using mass spectrometry
질량분석기는 물질을 이온화시켜 질량 대 전하의 비(m/z)를 측정하는 방식으로 분자량을 측정하고 이온의 fragmentation pattern을 분석하여 분자의 구조를 규명하는 분석방법을 이용하는 질량분석법을 이용하는 장비이다[10]. 프로테움의 분석은 단백질을 이온화하는 질량 분석기를 이용함으로써 큰 발전을 이루었다. 단백질의 이온화는 펩타이드 같은 비휘발성 물질을 기체 이온으로 만들어 질량분석을 하게 만들어 단백질의 변형 또는 파편화 없이 분석이 가능하게 하였다. 단백질을 이온화 하는 방법은 크게 electrospray ionization (ESI)와 matrix-assisted laser desorption/ionization (MALDI)로 나눌 수 있다.
ESI의 경우 용액 상태의 조직샘플을 electrical potential을 가한 상태에서 가는 분사바늘을 통해 대기 중으로 분무하여 기체 이온을 생성하게 된다[11]. MALDI는 단백질에 nanosecond laser pulse를 조사하여 이온화한 다음, 이온화된 펩타이드는 진공관을 통하여 이동하여 detector로 도달하게 되며, 질량분석기(peptide mass fingerprint)를 통하여 분자량을 계산하게 된다[12].
Protein identification step using data base
질량분석기로 분석된 단백질은 MS-Fit (http://prospector.ucsf.edu), Mascot (http://www.Matrixscience.com) 등의 검색엔진의 데이터베이스를 통하여 동일한 무게와 피크 값을 가지는 단백질을 동정하게 된다[7].
Clinical validation of identified protein
이차원 전기영동을 이용한 단백질 정량연구
동정된 단백은 reference map과의 비교를 통해 각 샘플별로 단백의 증감을 측정이 가능하다(Fig. 3A, B). 이차원 전기영동 젤을 staining 후 고화질의 scanner와 PD-Quest software (Bio-rad)를 통해 데이터를 모은 후 각 환자별로 또는 각 질환별 단백질 발현들을 측정 후 비교 가능하다. 이를 통해 임상정보와 단백질 발현 여부를 통해 통계적인 분석으로 암 조직에 발현 증가를 보이는 단백질의 통계적 분석을 시행한다[7].

Clinical validation of identified protein. (A) A representative image of silver-stained 2-imensional electrophoresis gel and identified protein (red arrow). (B) Zoomed regions of the gel image and identified protein (red square) from normal and cancer tissues of 6 gastric cancer patients. (C) Protein expression of 5 gastric cancer cell lines using Western blot analysis. (D) Protein expression of gastric cancer patients using Western blot analysis. Protein expression is higher in cancer tissue than in normal tissue.
세포주와 조직에서 단백질 발현의 정량화를 통한 임상적 평가
동정된 단백은 항체를 이용한 Western blot을 통하여 세포주와 암 조직에서 발현여부를 확인한다(Fig. 3C, D). 조직에서 확인된 단백의 경우 면역화학염색을 통한 실제 암 조직에서의 발현을 확인한다. 이때 대량 환자군 연구에는 tissue microarray (TMA)가 유용하게 쓰인다[13]. TMA란 미리 만들어진 파라핀 블록에 일정한 크기의 조직을 심어 대량 환자를 한 슬라이드에 넣어 대량 연구에 쓰는 기법이다. Fig. 4A와 같이 종양조직을 한 샘플당 2 mm로 한다면 한 장의 슬라이드에 약 60명의 조직을 넣을 수 있다. 이러한 TMA의 장점은 염색 시 동일한 조건으로 시행함으로써 실험 조건을 같게 할 수 있고, 경제적으로도 360장의 염색을 6장으로 해결할 수 있어 매우 이득이다. 로봇을 이용하여 TMA를 제작하는 경우에는 더 작은 크기도 슬라이드에 넣을 수 있다. 환자의 TMA stage, cell type, survival이나 재발 여부 등의 환자 정보와 함께 종양조직에서 단백질 발현 여부를 정량화(Fig. 4B)하여 분석함으로써 단백질의 바이오 마커로서 가능성을 평가할 수 있다.
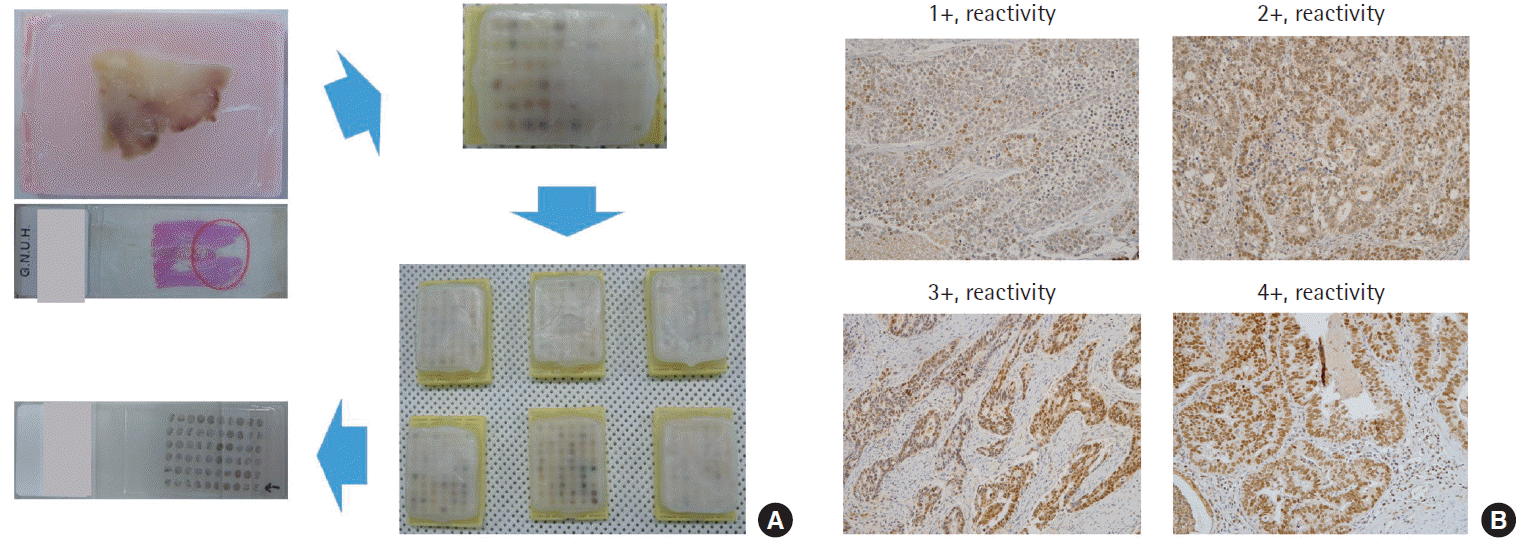
Tissue microarray (TMA) and immunohistochemistry scoring. (A) Flow chart of TMA. (B) Immunohistochemical scores according to tissue expression on a numerical scale of 1+ to 4+ (×200).
Functional analysis of biomarker candidate
세포주에서의 기능평가는 단백질이 실제 위암 세포내에서의 역할을 짐작하게 한다. 통상 shRNA를 이용한 단백질의 저발현 세포주와 plasmid를 이용한 과발현 세포주을 이용하여 단백질의 과발현과 저발현 시 세포주의 표현형의 변화를 평가한다. 이 경우 stable cell-line 을 만드는 데 최소 몇 달이 걸리기 때문에 siRNA를 이용한 temporary한 저발현 실험은 실험 기간을 줄일 수 있다. 통상적으로 증식, 이동, 침윤 평가를 기본으로 시행하며, knock-in or knock-out 세포주와 control 세포주와의 차이를 확인하게 된다[13]. Fig. 5A–D의 저발현 세포주의 경우 proliferation assay는 차이가 없으나 migration, invasion assay에서 control에 비해 증가되었고, Fig. 5E–H의 과발현 세포주의 경우 역시 proliferation의 경우 큰 차이가 없었으나, migration, invasion의 경우 control에 비해 유의하게 감소되어 반대되는 결과가 나왔으므로 신뢰할 수 있는 결과라고 할 만하다. 단백질의 역할에 따라 항암제 내성검사 등을 시행하기도 한다.
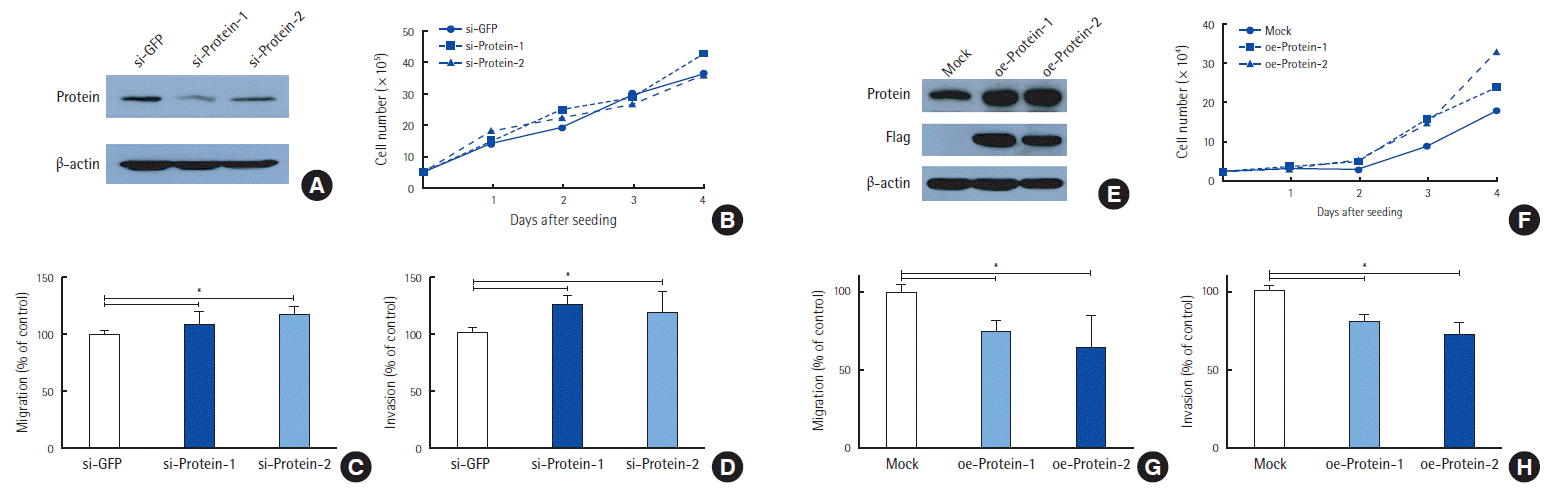
Functional analysis of candidate biomarkers by knock-out (A-D) and knock-in (E-H). (A) Two different siRNA groups show more down-regulated protein expression compared to the control si-GFP group. (B) There were no significant differences in proliferation assay between control and siRNA groups. (C) The migration rates were greatly increased in the siRNA group compared to the control group. (D) The invasion rates were markedly increased in the siRNA group compared to the control group. (E) Two different over-expression groups (oegroups) show more up-regulated protein expression compared to the control group (Mock). (F) There is no significant difference in proliferation assay between the control and oe-groups. (G, H) The migration and invasion rates were greatly decreased in the oe-groups compared to the control group. GFP, green fluorescent protein.
동물실험까지 실험한 경우 매우 믿을 만한 결과라고 할 수 있다. 동물실험의 경우 과발현 또는 저발현 세포주를 대조군과 함께 통상적으로 피하 또는 복강 내 주입함으로써 tumor gross, metastasis의 차이를 보게 된다.
위암에서의 프로테움 연구
위암에서도 바이오 마커 연구가 활발히 진행되고 있다. 하지만, 현재까지 상용화된 연구는 Trastuzumab for Gastric Cancer trial (ToGA)에 의한 Her2 이외에는 molecular biomarker는 전무한 지경이다[14]. 현재 위암에서 프로테오믹스 기법을 이용하여 연구들은 꾸준히 발표되고 있다[15]. 각 source에 따른 연구를 간단히 살펴보면, 먼저 혈액을 이용하여 조기 진단을 위한 연구는 활발히 진행되고 있다. Liu 등[16]에 의해 plasminogen, apolipoprotein A-IV, Kininogen-1, complex-forming glycoprotein HC, complement component C4A, apolipoprotein J, clusterin 등의 7개 단백이 위암에서 유의하게 높아져 있음을 high-performance liquid chromatography (HPLC)를 이용하여 발표하였고, Ahn 등[17]은 epidermal growth factor receptor (EGFR), pro-apolipoprotein A1 (proApoA1), apolipoprotein A1, transthyretin (TTR), regulated upon activation, normally T-expressed and presumably secreted (RANTES), D-dimer, vitronectin (VN), interleukin-6, α-2 macroglobulin, C-reactive protein and plasminogen activator inhibitor-1 등 13개의 단백을 포함한 29개 바이오 마커 후보물질로 구성된 serum array platform을 통하여 정상인에 비해 위암환자에서 유의한 결과를 나타내었다. Serum macrophage migration-inhibitory factor와 serum glycoproteomic analysis 역시 biomarker로 연구되고 있다 [18,19].
Mohri 등[20]은 21명의 위 정상조직, 위암 조직 및 혈액을 이용하여 human neutrophil peptides 1-3 (HNPs 1-3)와 macrophage migration inhibitory factor (MIF)가 위암환자에서 유의하게 증가된 것을 밝혔다. Wu 등[21]도 glucose-regulated protein 78 (GRP78), glutathione s-transferase pi (GSTpi), apolipoprotein AI (ApoAI), alpha-1 antitrypsin (A1AT) and gastrokine-1 (GKN-1)이 위암 조직에서 증가됨을 proteomics를 이용하여 동정하였고, Western blot과 면역화학염색법으로 종양조직에서 증감을 확인하였다.
Gastric juice 역시 조기진단의 바이오 마커 중 하나로 주목받고 있다[22]. Kon 등[23]은 위암 환자에서 pepsinogen A and pepsinogen C activation peptide가 저발현되고, alpha-defensin 1–3이 gastric fluid에 증가되어 있음을 발견하였고, 면역화학검사상 gastric adenocarcinoma tissue에 포함된 중성구에서 alpha defensin이 발현되는 것을 보고하였다. Wu 등[24]은 gastritis 환자와 조기 위암 및 진행성위암환자를 대상으로 연구하였고, S100A9, GIF, AAT 등이 의미 있는 바이오 마커로 보고하였다. 또한 위궤양과 위암을 비교하는 연구에서 α1-antitrypsin이 바이오 마커 후보로 발표되기도 하였다[25].
결 론
단백체학의 경우 바이오 마커 연구에 하나의 중요한 방법이다. 직접적으로 임상정보와 함께 중요성을 분석도 가능하고, 이를 기반으로 기능 연구 등을 통해 암 발생의 기전도 연구해볼 수 있겠다. 하지만, 단백체학 단독 연구의 한계는 존재하며, 이를 극복하기 위해 여러 단백질들의 조합을 이용한 panel이 시도되고 있으며, 이와 함께 DNA, RNA & epigenetics 등 여러 물질을 이용한 다각적인 연구가 필요할 것으로 생각된다.
Notes
No potential conflict of interest relevant to this article was reported.