INTRODUCTION
The qualitative and quantitative alteration of mucin expression in preneoplastic and neoplastic lesions has indicated its potential roles in neoplastic processes, as reviewed by Cozzi et al. [1]. Furthermore, numerous pieces of evidence indicate a close association between aberrant mucin expression and aggressive malignancies. Recently, various mucins (MUC1, MUC2, MUC3, MUC4, MUC5AC, MUC6, MUC7, and MUC8) have been used to evaluate the mucin phenotypes associated with gastric cancer [2].
Normal gastric mucosa shows cell type specific expression of MUC1, MUC5AC, and MUC6 with first two mucins found in the superficial epithelium and MUC6 in the deep glands [3–5]. Normal gastric mucosa does not express MUC2 and de novo expression begins in the intestinal metaplasia [4,6]. Alteration of mucin expression happens in gastric carcinomas and it was reported that gastric carcinomas contain a higher level of MUC1 expression than normal gastric mucosa. In contrast to the increased expression of MUC1 and MUC2, MUC5AC, and MUC6 expression decreased during gastric carcinogenesis. Controversies and conflicting data exist among studies that elucidated the relationship between the changes in mucin expression and the effect on prognosis and there is no absolute study showing the alteration of mucin expression in different histologic types.
The primary purpose of this study was to determine the relationship between MUC1, MUC2, MUC5AC, and MUC6 expression and patient prognostic factors and to investigate alterations in MUC1, MUC2, MUC5AC, and MUC6 expression in advanced gastric cancer.
METHODS
We performed surgeries for a total of 540 patients with gastric adenocarcinoma at the Memorial Jin Pok Kim, Korea Gastric Cancer Center, Inje University College of Medicine, Seoul Paik Hospital, Seoul, Korea between January 2005 and December 2008. Of these, 303 patients were excluded from the study because they had early gastric cancer, other synchronous or metachronous cancers, or were undergoing palliative operation and/or chemoradiation therapy for gastric cancer. The study population consisted of 237 patients with advanced gastric cancer who underwent curative surgery. The included patients did not receive any anti-tumor treatment before surgery and provided complete clinical records. After hematoxylin-eosin staining, all tissue sections were diagnosed as adenocarcinoma by two experienced pathologists in our hospital. The patients with stage II and III cancer received adjuvant immunochemotherapy. Adjuvant immunochemotherapy was administered as follows: at the 5th postoperative day, OK 432 (Streptococcus pyogenes preparation) was given with a dosage of 1.0 KE (Klinische Einheit). At the 8th postoperative day, mitomycin C (MMC) 4 mg/50 kg and 5-flurouracil (5-FU) 800 mg/50 kg injection were administered twice per week for 2 consecutive weeks. After 6 consecutive weeks, MMC and 5-FU injection were administered once per week. After finishing the injection chemotherapy regimen, we switched to oral 5-FU 800 mg/50 kg per day for 2 years. Medical records and computerized records of patients with reference to clinicopathological data were collected. Based on pathologic examination, the clinical stage, T-stage, N-stage, stage, tumor size, histologic type, venous invasion, lymphatic invasion, neural invasion, Lauren classification, tumor location, human epidermal growth factor receptor 2 (HER2) status and MUC (MUC1, MUC2, MUC5AC, and MUC6) expression were retrospectively analyzed. HER2 positive was defined as either immunohistochemistry (IHC) score 2+/amplification method by silver-enhanced in situ hybridization (SISH)+ or IHC score 3+ according to the gastric cancer scoring system. Follow-up assessments were performed every 3 months for the first 2 years after surgery, then yearly thereafter. The follow-up assessments included a medical history, physical examination, routine blood testing, including tumor markers (carcinoembryonic antigen and carbohydrate antigen 19-9), upper endoscopy, a chest radiograph, and other imaging studies (abdominal sonogram and computerized tomography). Biopsy and radiologic imaging study confirmed recurrence.
Immunohistochemical staining and evaluation: MUC1, MUC2, MUC5, MUC6
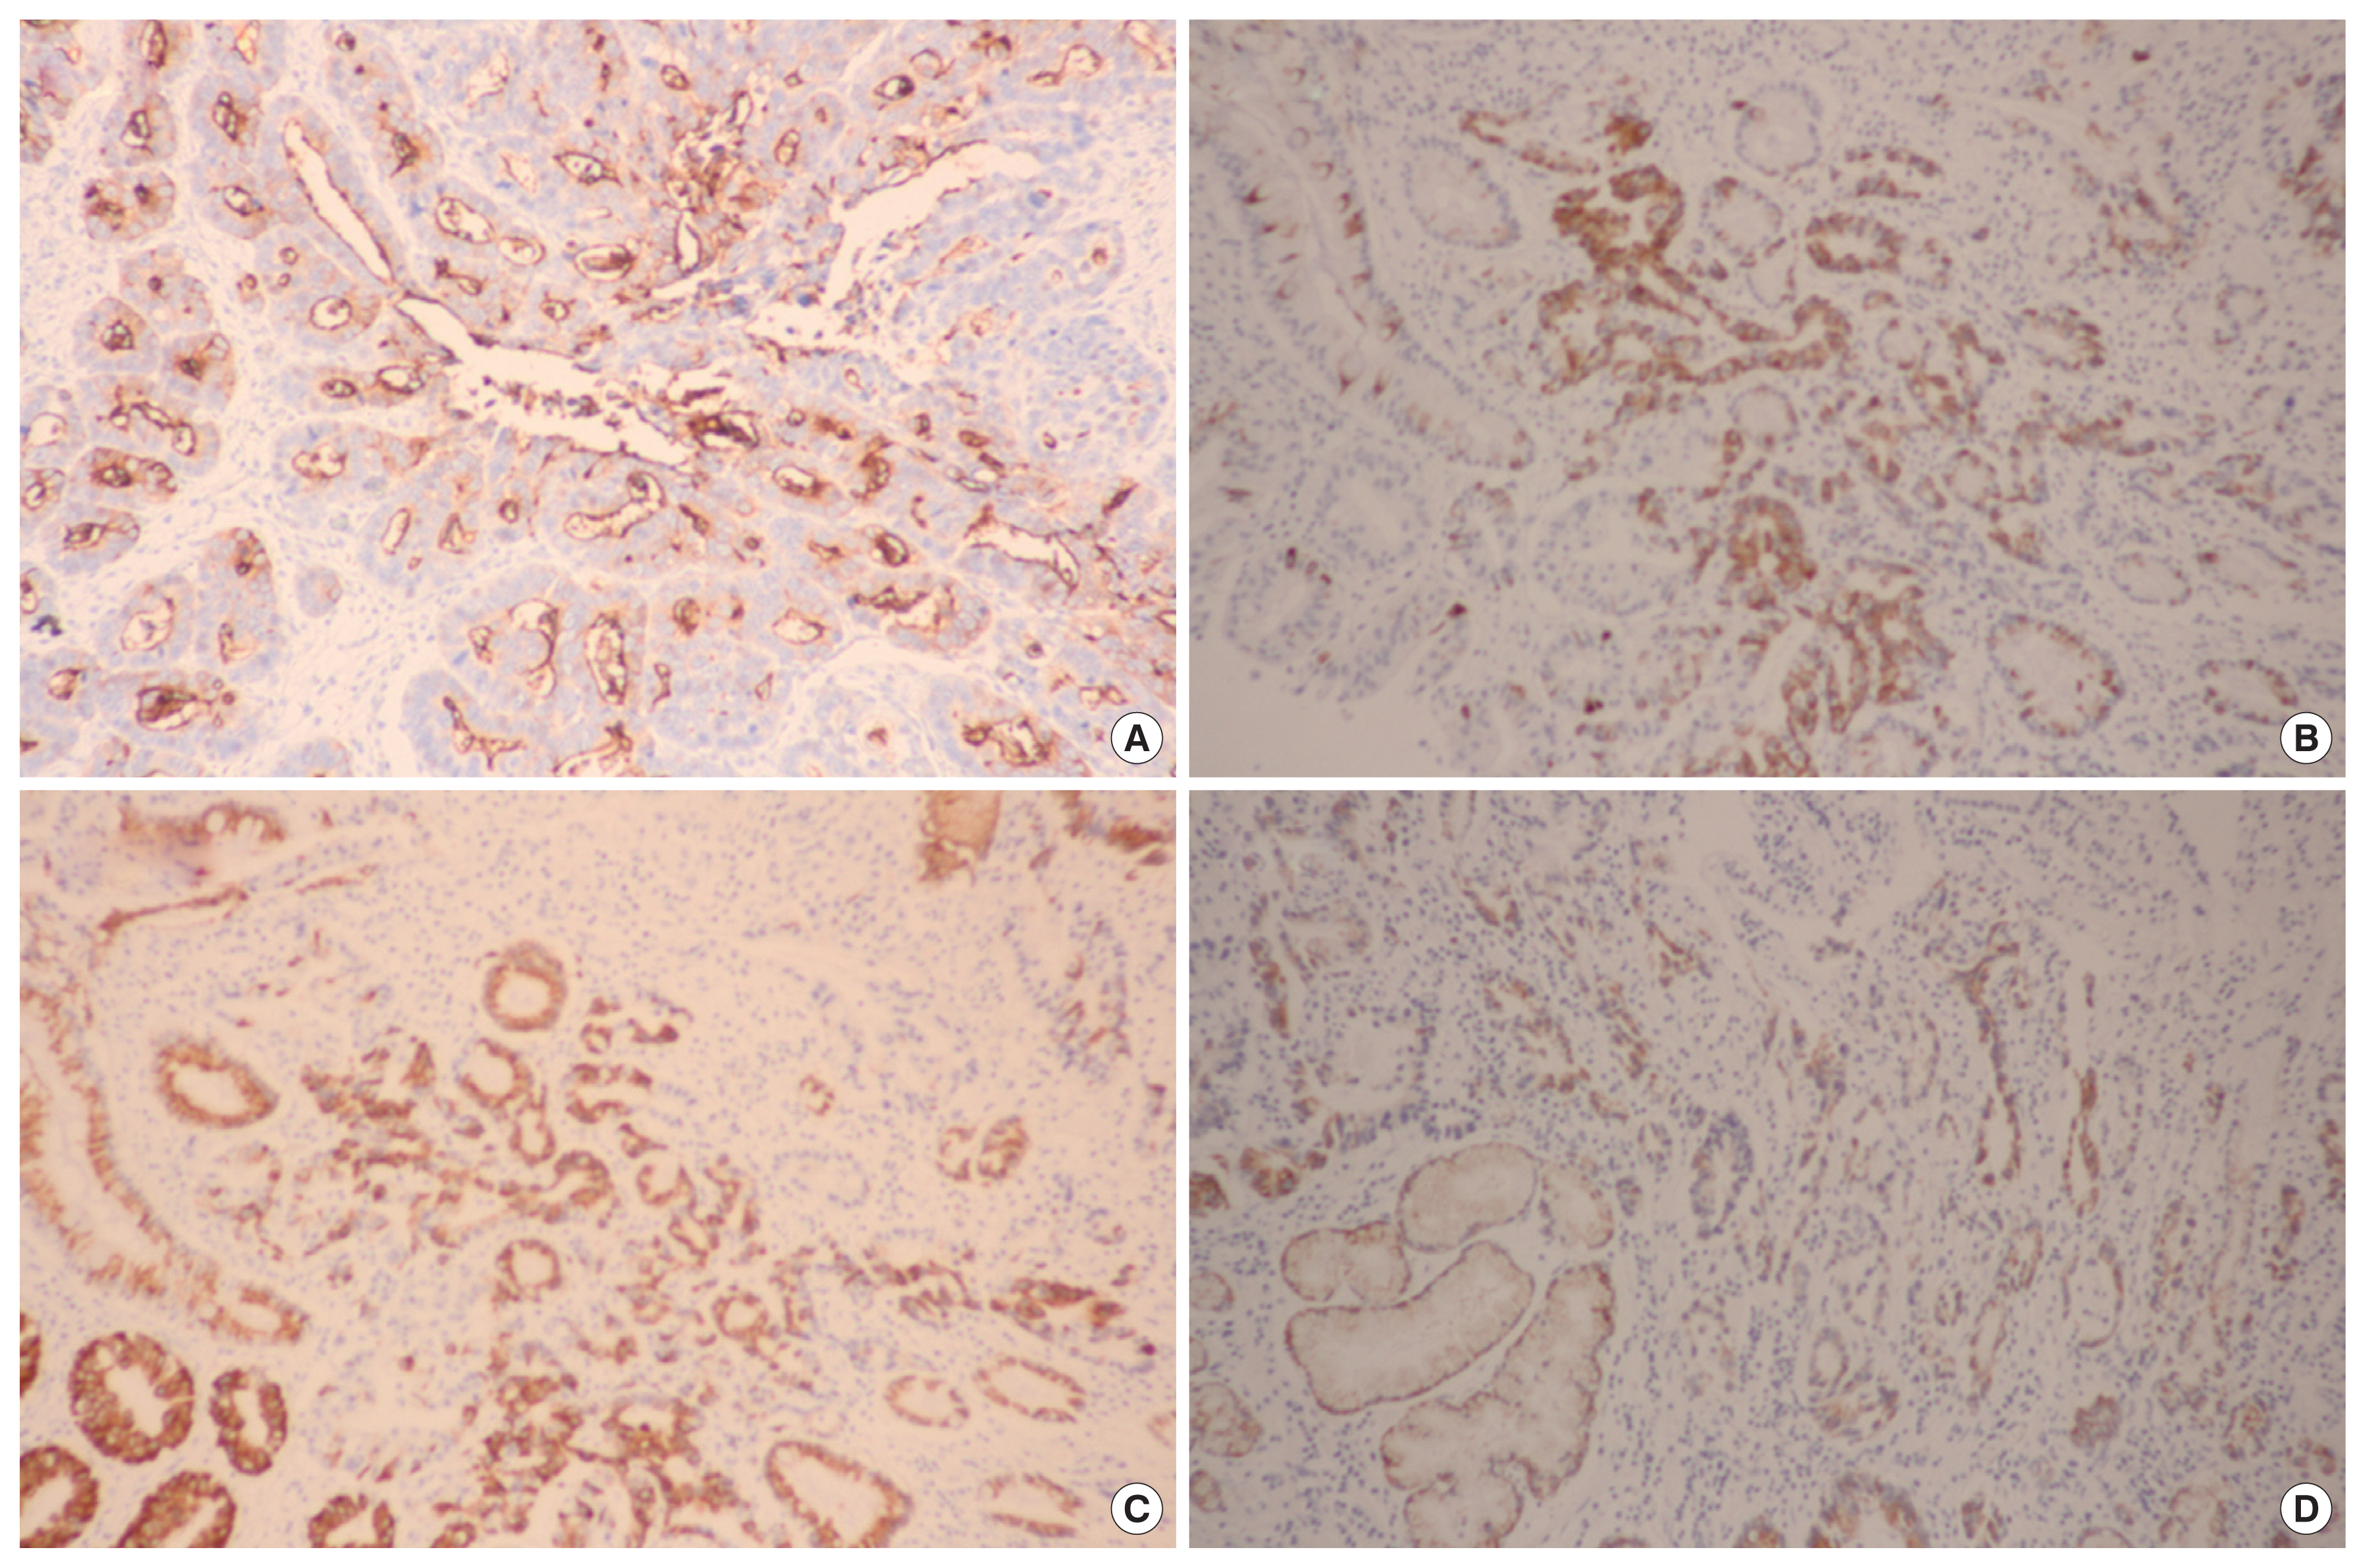
Sections were deparaffinized & hydrated by a routine xylene-alcohol series. For antigen retrieval, sections were treated with 0.01 M citrate buffer (pH 6.0) for 5 minutes in a microwave oven followed by treatment with 3% H2O2 to quench endogenous peroxidase activity. Sections were treated with normal serum of the host animal of the secondary antibody to block nonspecific binding. Sections were then incubated with anti-MUC1 antibody (1:100; Novocastra, Newcastle, UK), anti-MUC2 antibody (1:100; Novocastra), anti-MUC5AC antibody (1:100; Novocastra), and anti-MUC6 antibody (1:100; Novocastra) as described previously. Immunohistochemical stains were performed using a compact polymer method using a Bond Intense Detection Kit (Leica Biosystems, Wetzlar, Germany). Visualization was performed by treatment with 3,3′-diaminobenzidine (Vector Laboratories, Burlingame, CA, USA). To confirm the reaction specificity of the antibody, a negative control stain without primary antibody was utilized. All immunostained sections were lightly counterstained with Mayer hematoxylin. Immunohistochemical stains were evaluated by two pathologists. MUC1, MUC2, MUC5AC, and MUC6 revealed immunoreactivity in the cytoplasm or cell membrane of tumor cells. Immunostaining results were considered positive if more than 10% in the cytoplasm or cell membrane of tumor cells were stained (Fig. 1).
Statistical analysis
Statistical analysis was performed using SPSS software version 12.0 (SPSS Inc., Chicago, IL, USA). Cancer-related survival time was calculated from the day of surgery to the date of tumor-related death. Categorical variables were analyzed using the chi-square test and Fisher exact test. In the multivariate analysis, a logistic regression analysis was applied to identify independent clinicopathological factors. Survival curves were estimated using the Kaplan-Meier method and the significance of differences between survival curves was determined using the log-rank test. Multivariate analysis was performed using Cox proportional hazards regression modeling. P-values < 0.05 were considered significant. The study was reviewed and approved by the Seoul Paik Hospital Institutional Review Board (PAIK 2018-03-003). The informed consent was waived.
RESULTS
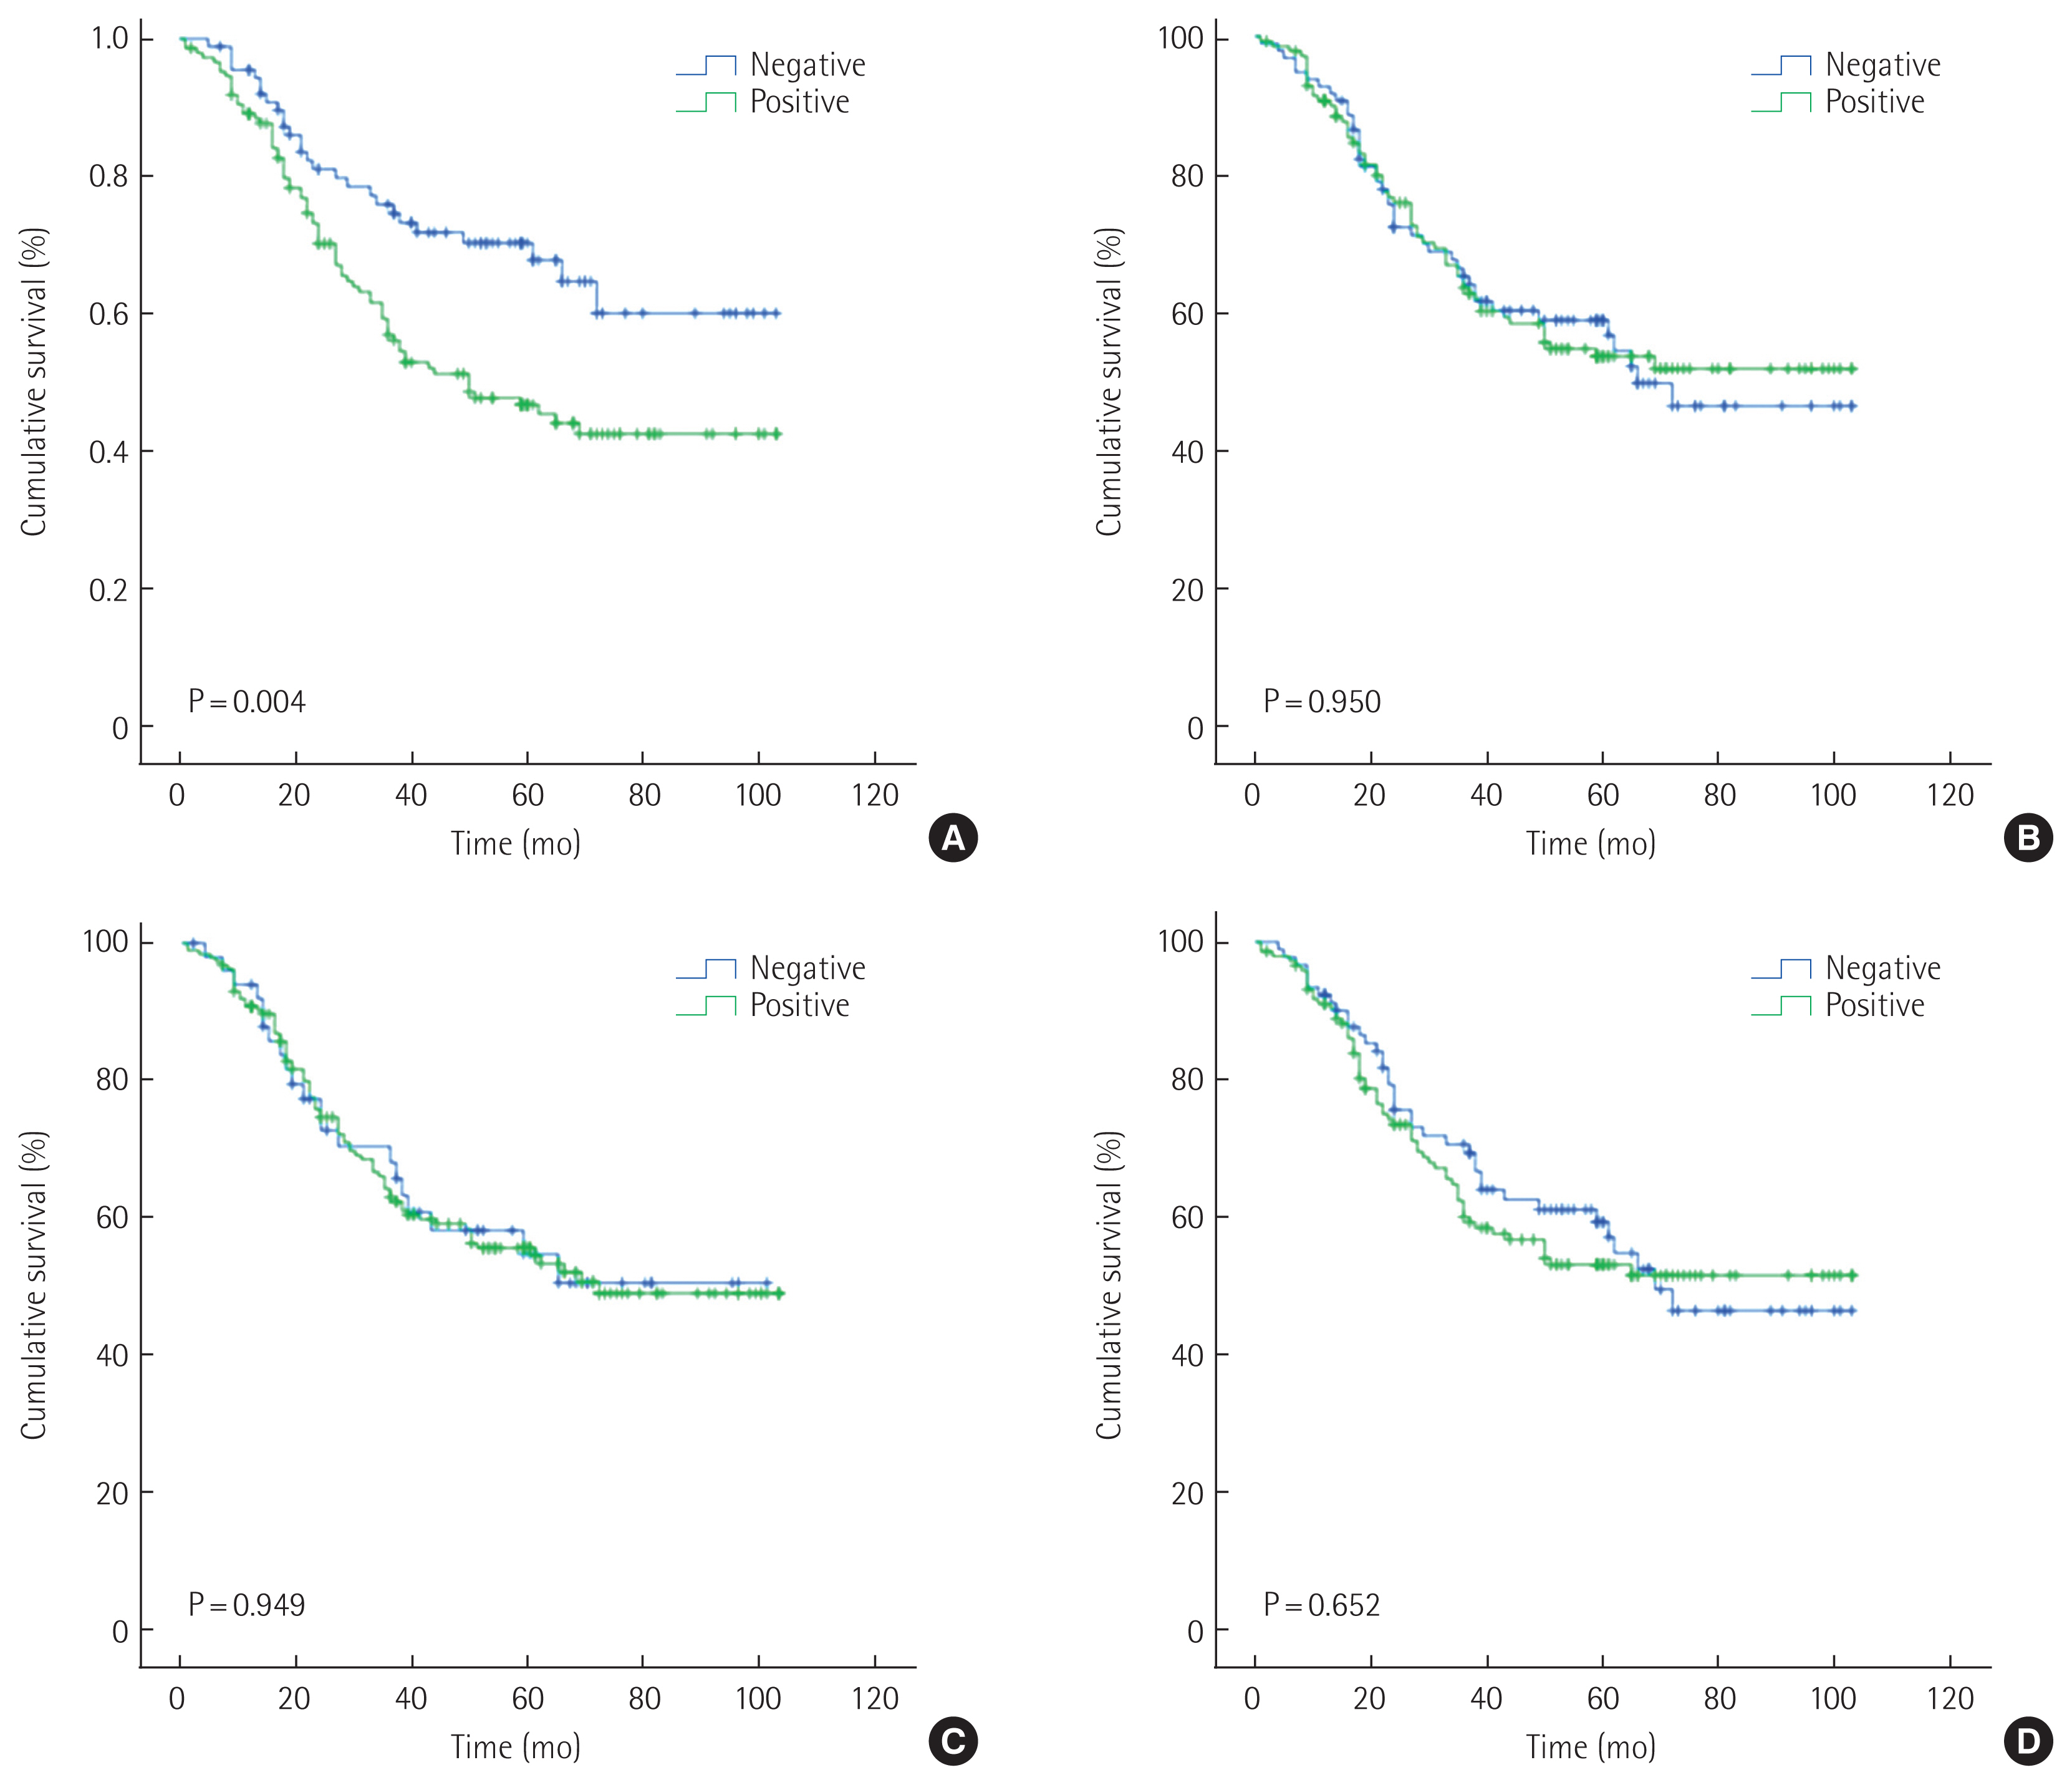
The study group consisted of 237 patients (150 men [63.3%] and 87 women [36.7%]) between 28 and 84 years of age (mean age, 60.5 years). The conditions of these patients were assessed according to the 7th TNM classification. Table 1 shows the clinicopathologic relationship of MUC1, MUC2, MUC5AC, and MUC6 expression. MUC1 expression was identified in 148 out of 237 patients (62.4%) and was correlated with age, HER2 status, lymphatic invasion, Lauren classification, and histology in univariate analysis. Further multivariate logistic regression analysis revealed that MUC1 expression is found to correlate with lymphatic invasion and diffuse type of Lauren classification. MUC5AC was identified in 186 out of 237 patients (78.5%) and was correlated with HER2 status, Lauren classification, and histology. Further multivariate logistic regression analysis revealed that MUC5AC expression is found to correlate with HER2 status, diffuse type and mixed Lauren classification. MUC2 was identified in 141 out of 237 patients (59.5%) and was not correlated with clinicopathologic factors. MUC6 was identified in 146 out of 237 patients (61.6%) and was not correlated with clinicopathologic factors. Kaplan-Meier analysis indicated that the survival rate was related to MUC1 (P= 0.004), MUC2 (P= 0.950), MUC5AC (P= 0.949), and MUC6 (P= 0.652) (Fig. 2). According to stages, MUC1 expression positively correlated with a probability of lower survival in stage II (P= 0.028). In an additional multivariate analysis that used the Cox proportional hazards model, MUC1 expression was not significantly correlated with patient survival independent of age, N-stage, and venous invasion (Table 2).
DISCUSSION
Many prognostic factors for gastric cancer have been studied, but TNM stage is still the most influential. There is no clear consensus about the pathogenesis of gastric cancer and the value of the MUC as a prognostic factor.
MUC1 is a membrane-bound mucin that plays an important role in the impairment of cell-adhesion, the immune response, and altered intracellular signaling. In addition, MUC1 is involved in the development and progression of gastric cancer [7]. Several studies have demonstrated that the increase in MUC1 expression in gastric cancer was statistically significant, with worse differentiation and higher rates of lymph node metastasis [8–10]. In a recent meta-analysis, MUC1 expression in gastric cancer was correlated with a lower 5-year survival rate [11]. Although many therapies targeting MUC1 expression have been developed, there is not yet definitive recommendations for clinical application [12]. In our study, MUC1 expression was positively correlated with lymphatic invasion and diffuse type of Lauren classification. Furthermore, like the previous meta-analysis [11], MUC1 expression was correlated with cancer-specific survival. This indicated that MUC1 expression may be considered as prognosis for survival in patients with gastric cancer.
MUC2 is a secretory apomucin and presents mainly in the goblet cells of the small intestine, large intestine, and bronchus. MUC2 is also called “goblet cell mucin [13].” In the stomach, MUC2 expression was not found in normal gastric mucosa, but de novo expression of intestinal MUC2 was observed (> 75%) in intestinal metaplasia and its expression displayed a diffuse cytoplasmic pattern in goblet cells [6]. In another study, the expression of MUC2 was noted in non-goblet cells of the foveolar epithelium in the stomach, but was not found in other cell types, including the fundic glands in the stomach [13]. MUC2 expression is higher in the intestinal metaplasia of gastric non-neoplastic mucosa than in gastric cancer, indicating that down-regulated MUC2 might play an important role in gastric carcinogenesis and reduced MUC2 expression might be closely linked to the growth, invasion, and progression of gastric cancer [14]. In this study, MUC2 expression was observed in 57.8% of gastric cancers and had no relavant clinicopathologic factors.
MUC5AC is a secretory apomucin and is found mainly in gastric foveolar cells. MUC5AC is also called “gastric foveolar mucin [13].” Generally, in the normal stomach, the expression of MUC5AC is found in the foveolar cells, but not in the fundic or pyloric glands [13]. The overexpression of MUC5AC observed in the intestinal metaplasia compared to that in gastric cancer suggest that MUC5AC is down-regulated in gastric carcinogenesis [14]. Ilhan et al. [8] found a low expression of MUC5AC (10%) in gastric ordinary carcinoma and Terada [13] found a different expression rate of 67% in the signet ring cell type of gastric cancer. MUC5AC was found to be inversely associated with depth of tumor invasion, lymph node metastasis, liver metastasis, and tumor stage [15]. In this study, MUC5AC expression was correlated with HER2 status and, mixed and diffuse type of Lauren classification. However, MUC5AC was not correlated with prognostic factor.
MUC6 is also a secretory mucin and is found largely in the pyloric glands of the stomach, duodenal Brunner glands, and esophageal glands. MUC6 is also called “pyloric gland-type mucin [13].” Generally, in the normal stomach, expression of MUC6 is detected in the glands of the antrum ( >75%), but there is decreased expression during the process of gastric carcinogenesis [6]. Like MUC5AC, the down-regulation of MUC6, may be associated with carcinogenesis, malignant potential, and the biological behavior of gastric cancer. In this study, MUC6 expression was not correlated with clinicopathologic factors.
In conclusion, when each of these four MUCs expression is evaluated, in the light of clinicopathologic factors, MUC1 expression may be considered as a prognostic factor in patients with advanced gastric cancer. Therefore, careful follow-up may be necessary because the prognosis is poor when MUC1 expression is present


